Your bot reads the chart
Every scan a bot runs is a structured read of its chart: a verdict with entry zone, stop-loss, take-profit, confidence, and higher-timeframe alignment. This page explains what that read contains and how to judge it.
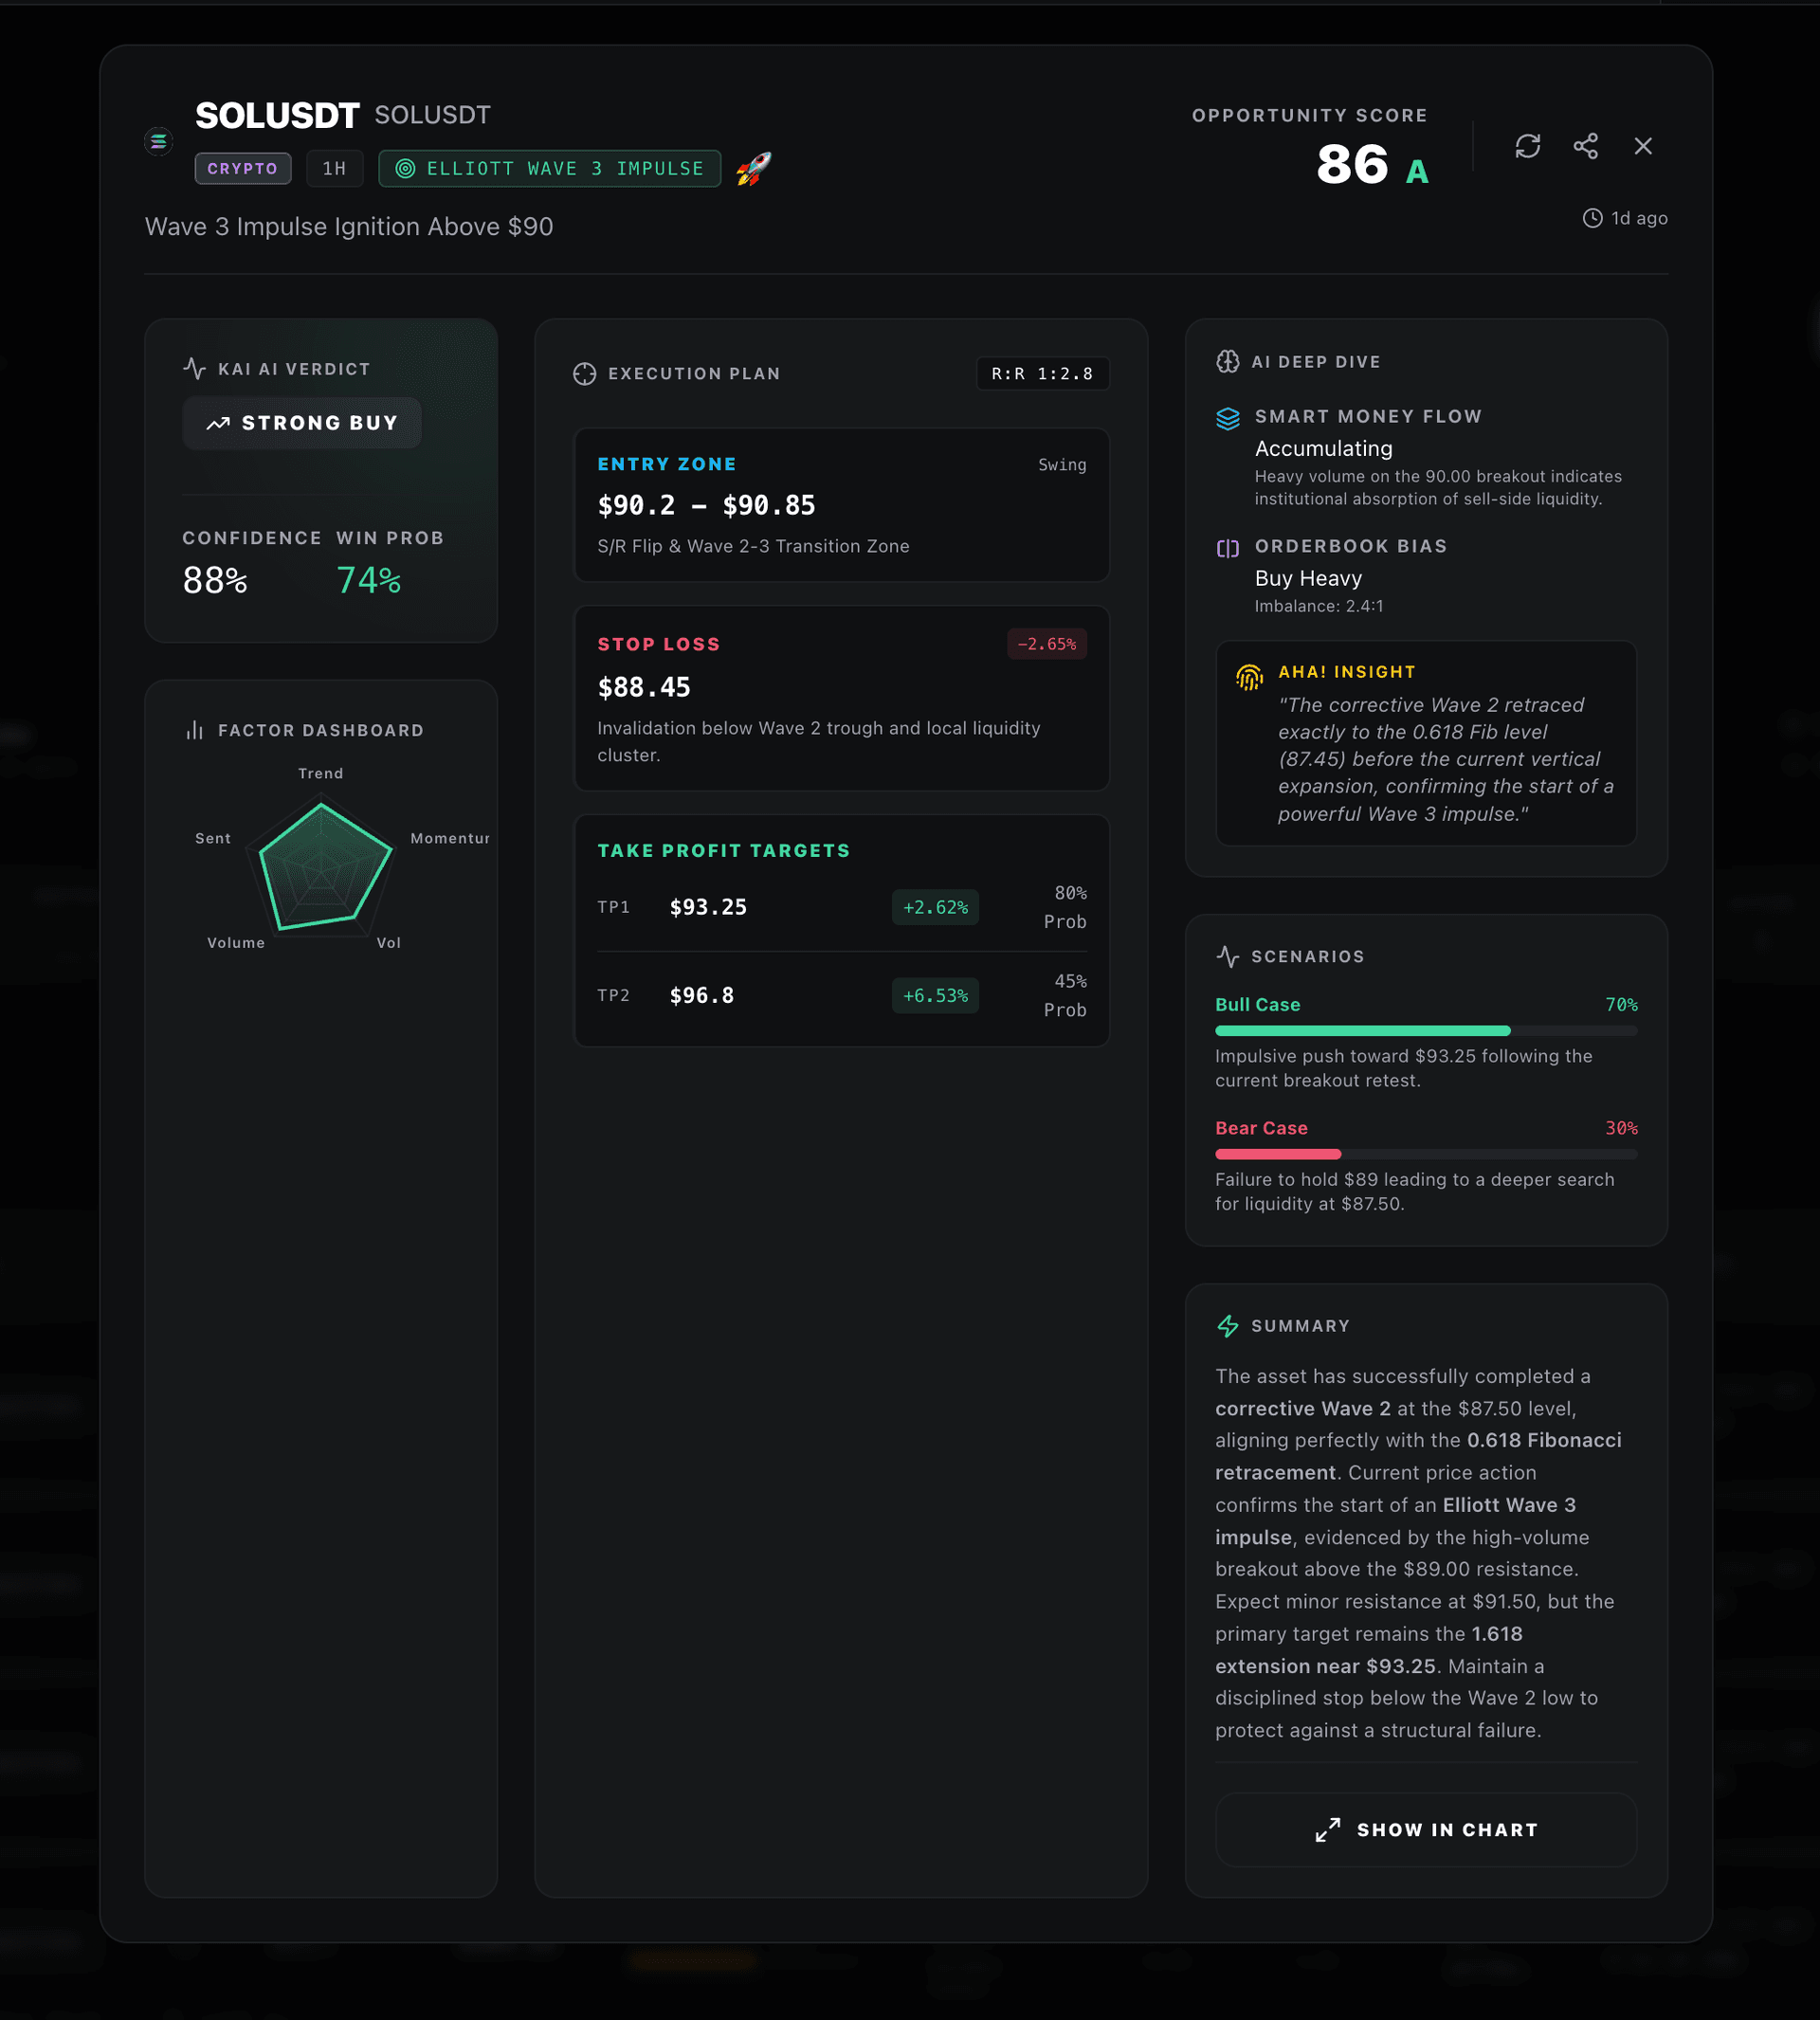
The read — verdict, execution plan, and supporting signals
What a Scan Returns
A bot does not just watch price. On each scan it runs a full structured read of its chart and writes the result to its timeline as a verdict card.
The read always includes:
- Verdict — BUY, SELL, or WAIT.
- Entry zone — price range to enter.
- Stop-loss — invalidation level.
- Take-profit — profit target(s).
- Confidence — the AI's own conviction score.
- HTF alignment — whether higher timeframes agree.
- Supporting signals — indicators and structure backing the call.
When It Runs
On the bot's own cadence
You do not have to trigger the read — the bot does it on its own. Deploy a bot on a symbol and it re-reads the chart on a cadence floored to its timeframe, then writes what it saw to its timeline. You can also ask for a scan on demand from the bot's conversation.
What You Control
The bot's config is what shapes every read it runs.
Symbol
The one market the bot watches — crypto, stocks, or forex.
Timeframe
Sets the candle resolution the bot reads (15m, 4H, 1D, etc.) and how often it re-reads.
Risk
Biases SL/TP distances toward Conservative, Moderate, or Aggressive.
Strategy
The lens the bot reads through — Wiz, Elliott Wave, Fibonacci, Cycle, MACD, MA Cross, or Gann swings.
Reading the Verdict Card
Top line
The verdict (BUY / SELL / WAIT) and confidence percentage. Anything under 60% is a skip by engine rules.
Execution plan
Entry zone, stop-loss, and take-profit — all validated for direction before display.
HTF alignment
Summary of how higher timeframes stack with the call. Disagreement means the setup is counter-trend.
Supporting signals
Bullet list of indicators, levels, and structural reads the model used to justify the verdict.
Usage Limits Per Plan
Starter Free
Limited credits and a slower scan cadence. Levels on the verdict card are partially blurred.
Pro $39/mo
Multiple bots, full verdict cards, and standard AI throughput.
Ultimate $99/mo
Unlimited bots, live web search, chart vision on every scan, and the order-flow feed.
Next: Risk Management
See the guardrails that apply to every verdict before a trade is opened.